Flowcharts are very helpful tool to visualize a process, make a decision, or understand the flow of data. A flowchart is a diagram that shows the steps involved in a process or algorithm. Flowcharts are used to visualize and communicate complex processes in a clear and easy-to-understand way. They can also be used to document processes, identify potential problems, and improve efficiency. Flowcharts are written using boxes and arrows. The boxes are of different shapes which represent steps in the process. The arrows represent the flow of information between steps. The different types of boxes commonly used in flowcharts are:
- Process step: A process step is a rectangular box that represents a single step in the process.
- Decision: A decision box is a diamond shaped box that represents a point in the process where a decision must be made.
- Input & Output: A parallelogram shaped box represents both data or information that is entered into the process and data that is produced as output from the process.
- Terminator: A pill shaped box that is used to represent the start and end of the flowchart.
Here are some of the different types of flowcharts that are used:
- Process flowchart: This type of flowchart shows the steps involved in a process. It is often used to document a process or to improve a process.
- Decision flowchart: This type of flowchart shows the steps involved in making a decision. It is often used to help people make decisions or to document the decision-making process.
- Data flow diagram: This type of flowchart shows the flow of data through a system. It is often used to document a system or to improve a system.
Flowcharts can be a helpful way to visualize a process, make a decision, or understand the flow of data.
Flowcharts can be used to represent a wide variety of processes, such as:
- Business processes: Flowcharts can be used to document business processes, such as the order fulfillment process or the customer service process.
- Software development processes: Flowcharts can be used to document software development processes, such as the requirements gathering process or the testing process.
- Scientific research processes: Flowcharts can be used to document scientific research processes, such as the experimental design process or the data analysis process.
Here are some of the benefits of using flowcharts:
- Improved communication: Flowcharts can help to improve communication by providing a visual representation of a process. This can be helpful for explaining processes to others, such as new employees or customers.
- Increased efficiency: Flowcharts can help to identify inefficiencies in processes and make it easier to recommend improvements. This will increase efficiency and productivity.
- Reduced errors: Flowcharts can help to reduce errors by providing a clear and structured way to document processes. This can help to ensure that steps are not skipped or repeated incorrectly.
- Improved quality: Flowcharts can help to improve the quality of products or services by ensuring that processes are followed correctly. This can lead to fewer defects and a higher level of customer satisfaction.
Overall, flowchart is a valuable tool that can be used to improve communication, efficiency and quality of a process, and productivity.
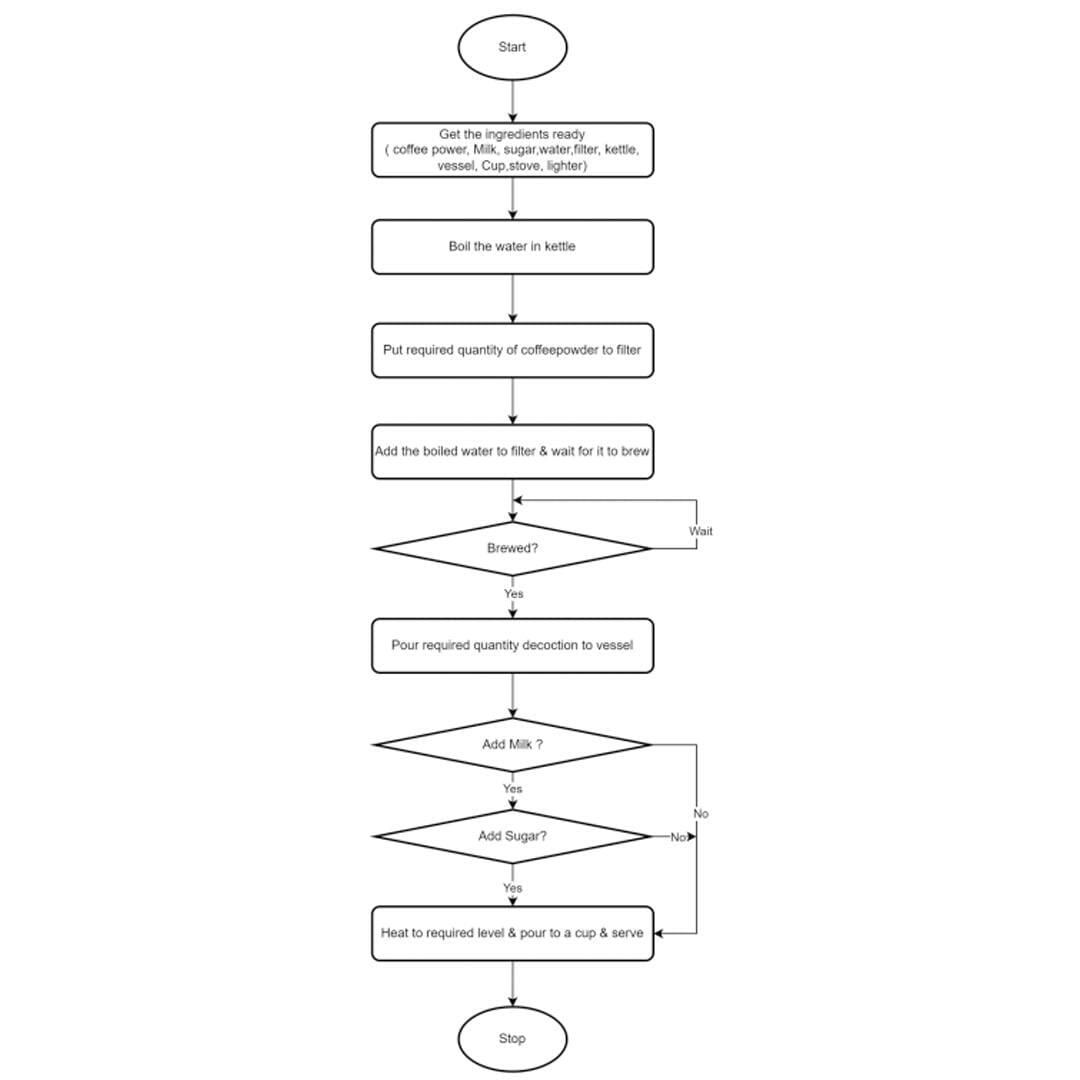
Example flowchart for making a cup of filter coffee.